
Revenue Leakage in Billing Patterns
Revenue rarely disappears overnight.
It leaks slowly through missed procedure codes, underpaid insurance claims, eligibility errors, and unresolved denials. Most practice owners do not notice the issue until cash flow tightens, accounts receivable crosses 60 days, or insurance reimbursements slow down.
The reality is simple: revenue leakage hides inside billing patterns.
Modern billing analytics platforms are built to detect those patterns early before they quietly erode profitability. This guide explains how data driven revenue leakage analysis works and why delaying action could cost more than expected.
What Is Billing Leakage?
Billing leakage refers to revenue lost due to errors, inefficiencies, or process gaps within the revenue cycle.
In dental and insurance based practices, common sources include:
- Missed procedure codes
- Incorrect CDT CPT coding
- Insurance underpayments
- Unresolved denial codes
- Eligibility verification failures
- Incomplete documentation
- Failure to bill adjunct or add on procedures
Individually, these seem minor. Over time, they reduce net collection rate, increase AR aging, and weaken financial stability.
Revenue Leakage Example Dental Practice Scenario
Consider a common scenario:
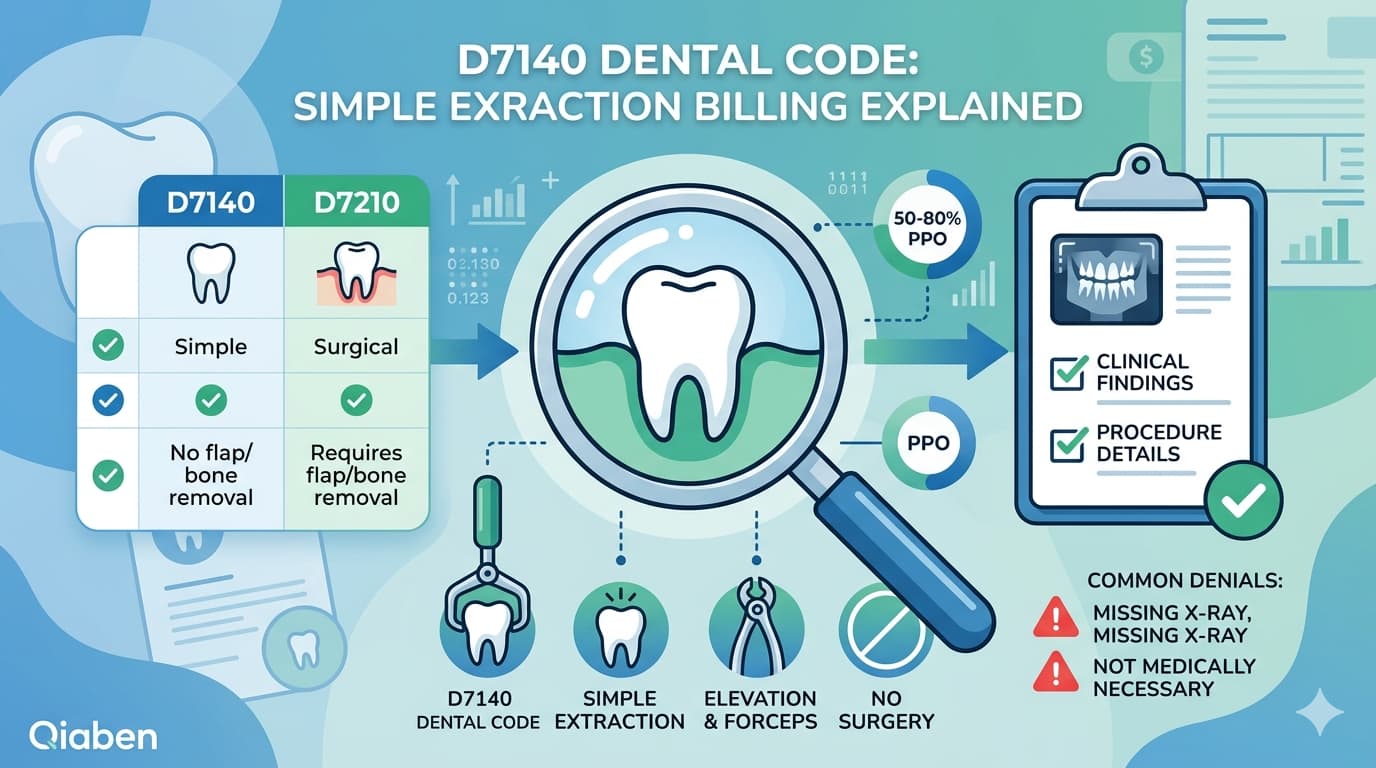
A practice performs surgical extractions but documents them as simple extractions. Insurance reimburses at a lower contracted rate.
The difference per procedure may not look alarming. But when multiplied across dozens of cases each month, the annual loss becomes significant.
Other examples include:
- Not billing for fluoride varnish when provided
- Missing anesthesia charges
- Failing to follow up on secondary insurance
- Accepting insurance underpayments without contract review
Without advanced analytics, these patterns remain hidden.
How Intelligent Billing Systems Detect Revenue Leakage
Modern billing systems analyze historical claims, denial codes, payer behavior, and coding trends. Instead of sampling a few charts, they evaluate 100 percent of billing data.
Here is how risk patterns are identified:
1. Repeated Denial Codes
If certain CDT codes repeatedly trigger denials, the system flags procedural or documentation gaps.
2. Underpayment Trends
Contracted reimbursement rates are compared against actual insurance payments to identify discrepancies automatically.
3. Missed Charge Detection
By cross referencing clinical documentation with submitted claims, the system highlights procedures that were performed but never billed.
4. Eligibility Denial Patterns
Frequent eligibility denials from specific payers reveal verification workflow weaknesses at the front desk.
5. AR Aging Clusters
The system identifies payer specific or procedure specific claims that consistently age beyond 60 to 90 days.
This is continuous revenue leakage analysis not quarterly sampling.
Plugging Revenue Leakage With Predictive Analytics
Advanced billing platforms do not just detect past problems. They anticipate future risk.
Predictive systems can:
- Identify high risk claims before submission
- Flag documentation gaps that may lead to medically not necessary denials
- Alert billing teams about duplicate claim risks
- Detect unusual write off behavior
- Monitor payer specific reimbursement patterns
By acting before submission, practices improve clean claim rate and reduce denial percentage.
Why Manual Audits Miss Hidden Patterns
Traditional billing audits review limited samples.
Advanced analytics review everything.
Manual audits might identify obvious errors. Intelligent systems uncover:
- Subtle reimbursement inconsistencies
- Provider specific documentation trends
- Payer behavioral patterns
- Frequency limitation risks
- Systematic coding variances
They connect clinical notes, billing entries, insurance responses, and payment data into one unified performance model.
Key Revenue Metrics Continuously Monitored
To prevent revenue leakage, advanced billing systems track:
- Clean claim rate
- Denial rate
- Net collection rate
- Insurance reimbursement turnaround time
- CDT coding variance
- Pre authorization approval rates
- Patient balance aging
- Contract compliance versus actual payments
When one metric shifts unexpectedly, the source is isolated quickly.
Interactive Self Assessment for Practice Owners
Take a moment to evaluate your practice:
- Do you review payer underpayments monthly
- Are denial codes analyzed by procedure type
- Is AR over 60 days increasing
- Do you know your clean claim rate this week
- Are write offs reviewed for unusual trends
If you are uncertain about three or more, revenue leakage may already be impacting your bottom line.
The Financial Impact of Ignoring Revenue Leakage
Small inefficiencies compound.
For example:
- 3 percent consistent underpayment across claims
- 5 percent missed charge capture
- 7 percent denial rate increase
Combined, these factors significantly reduce annual profitability.
What appears minor on a single claim becomes substantial across thousands of claims annually.
Why This Matters Now
Insurance reimbursements are tightening.
Payer audits are increasing.
Operational expenses are rising.
Practices that rely only on manual review processes risk falling behind competitors using advanced analytics.
Data driven billing analysis provides visibility, control, and predictability. The earlier patterns are detected, the easier they are to correct.
Final Thoughts
Revenue leakage is rarely dramatic. It is gradual, silent, and expensive.
Modern billing analytics uncover:
- Missed charges
- Coding inconsistencies
- Insurance underpayments
- Denial trends
- AR performance gaps
For practice owners seeking stronger margins, faster reimbursements, and predictable cash flow, proactive billing oversight is no longer optional.
If you want to understand how much revenue may be leaking from your practice
Get the TCO Calculator today and see the financial impact before another quarter passes.