How to Read Your RCM Dashboard and Understand the KPIs That Matter
Most practices look at their RCM dashboard. Very few actually read it.
If your accounts receivable keeps rising, insurance denials are increasing, or cash flow feels unpredictable, your KPIs are already warning you. The question is are you acting on them.
This guide explains how to read key performance indicators in Revenue Cycle Management RCM for dental billing and insurance focused practices.
What Is KPI in Revenue Cycle Management
A Key Performance Indicator in Revenue Cycle Management is a measurable value that shows how effectively your practice collects revenue from patient services.
KPIs show whether billing, coding, insurance verification, and collections processes are working or leaking revenue.
In dental billing and insurance workflows, KPIs directly affect clean claim rate, insurance reimbursement speed, patient collections, write offs, adjustments, and overall cash flow.
Ignoring KPIs compounds revenue problems over time.
KPIs Used to Evaluate RCM Effectiveness
When evaluating Revenue Cycle Management effectiveness, focus on performance metrics that measure claim accuracy, collection efficiency, payment timelines, denial patterns, and financial leakage.
Reliable RCM dashboards track dental insurance claims performance, CPT and CDT coding accuracy, eligibility verification, and accounts receivable performance.
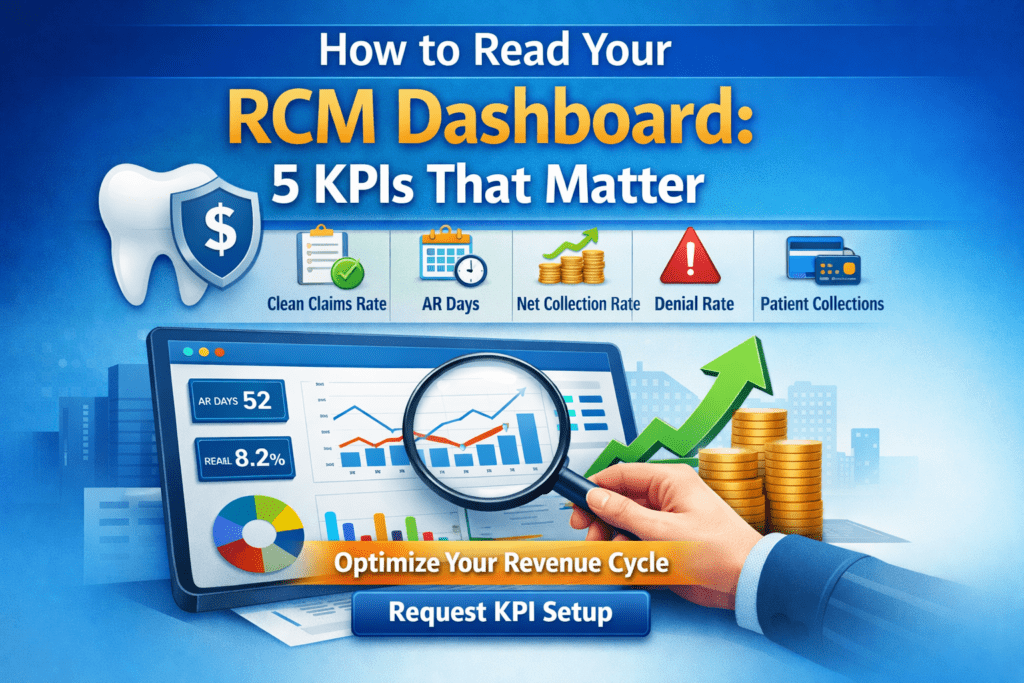
Five Key Performance Indicators in Healthcare That Impact Revenue
While healthcare tracks many performance metrics, these five KPIs determine whether your revenue cycle is healthy and sustainable.
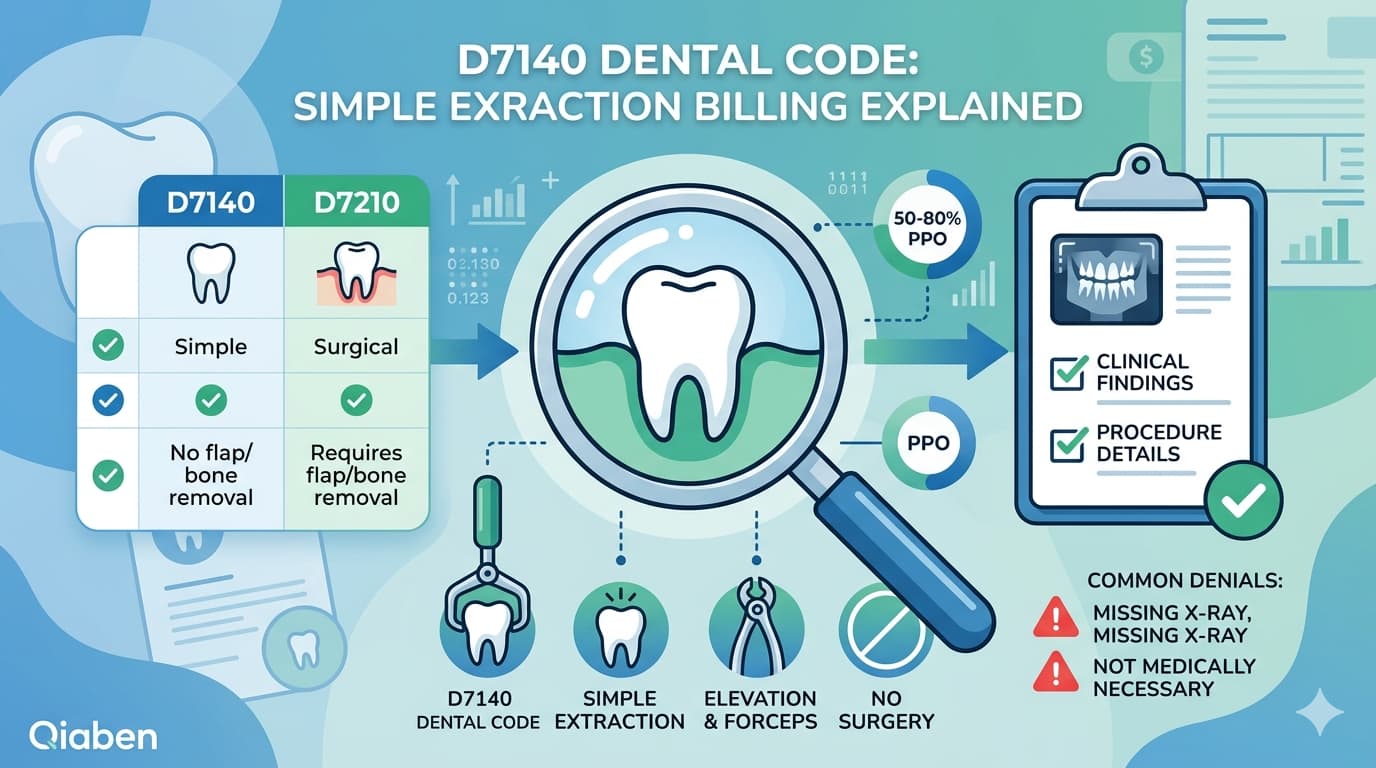
Clean Claim Rate
Clean claim rate measures the percentage of claims accepted by insurance payers on first submission.
A low clean claim rate increases denials, delays reimbursement, and raises administrative workload.
A healthy benchmark is 95 percent or higher.
If the rate falls below 92 percent, review coding accuracy, insurance eligibility verification, missing documentation, and patient demographic errors. For dental practices, CDT coding accuracy is critical.
Days in Accounts Receivable
Days in accounts receivable measures the average number of days it takes to collect payment after services are rendered.
A healthy benchmark is under 30 to 40 days.
If AR days are rising, insurance follow up may be inconsistent or claim resubmissions delayed.
Break accounts receivable into 0 to 30 days, 31 to 60 days, and over 60 days. Balances beyond 60 days require immediate insurance follow up.
Net Collection Rate
Net collection rate measures the percentage of collectible revenue your practice actually collects.
A healthy benchmark is 95 percent or above.
If net collection rate drops, check insurance underpayments, review write offs, and audit patient balance collection processes. This KPI reveals silent revenue loss.
Denial Rate
Denial rate measures the percentage of claims denied by insurance payers.
A healthy benchmark is below 5 percent.
High denial rates usually indicate incorrect coding, missing preauthorization, incomplete documentation, or patient eligibility errors. Recurring denial patterns should trigger workflow audits.
Patient Collection Rate
Patient collection rate measures how effectively your practice collects patient responsibility balances.
With rising deductibles, patient collections directly impact revenue performance.
Collect estimates upfront, offer digital payment options, and train front desk teams to explain insurance breakdowns clearly.
How to Read Key Performance Indicators Effectively
Focus on trends rather than single month snapshots.
Ask whether each KPI is improving month over month, whether it falls below industry benchmarks, which insurance payer is causing delays, and whether specific CDT or CPT codes are frequently denied.
Compare KPIs together. High denial rate combined with low clean claim rate suggests coding or eligibility issues. Rising AR days with stable claim volume indicates a follow up gap. Low net collection rate with high write offs signals adjustment leakage.
Five Key Performance Indicators in Healthcare Overall
Across healthcare, organizations commonly track patient satisfaction score, readmission rate, average length of stay, cost per case, and revenue cycle performance.
For dental billing and insurance focused practices, revenue cycle KPIs have the most direct impact on sustainability.
Why Monitoring RCM KPIs Is Urgent
Delayed reimbursements, rising insurance denials, growing accounts receivable, and increasing write offs are not random issues. They appear in your dashboard before cash flow declines.
Practices that review KPIs weekly outperform those that review quarterly because small corrections prevent large revenue gaps.
How to Take Action After Reviewing Your Dashboard
Identify the weakest KPI and trace the root cause. Determine whether issues stem from front desk intake errors, insurance verification gaps, coding mistakes, or lack of follow up.
Assign ownership to each KPI and track performance weekly to create measurable improvement.
Essential Dental Billing Metrics for KPI Tracking
Ensure your RCM dashboard tracks dental insurance verification rate, CDT coding accuracy, claim rejection percentage, insurance reimbursement turnaround time, preauthorization approval rate, and patient balance aging.
These metrics protect revenue in insurance dependent practices.
Final Thoughts on RCM Dashboard Optimization
A well designed RCM dashboard highlights risk, protects revenue, and guides operational decisions.
Stable growth and predictable cash flow often depend on consistently tracking five core KPIs.
Request KPI Setup today and turn your RCM dashboard into a revenue control center.